
On June 23, 2016, the United Kingdom voted to leave the European Union (EU). 51.9% of citizens voted to leave while 48.1% voted to remain; there were 1,269,501 more votes in the leave camp.
Here are the EU referendum results demographics.
According to the Financial Times, certain areas were overwhelming pro- or anti-EU. In regard to pro-EU, the most partisan local areas were Gibraltar (95.9%), Lambeth (78.6%), and Hackney (78.5%). For anti-EU, the most partisan local areas were Boston (75.6%), South Holland (73.6%), and Castle Point (72.7%).
Additionally, there were regional voter differences. London was the most adamant against leaving the EU, while the West Midlands were the most supportive of leaving the EU. The image below further explains the way regional differences influenced voters’ decisions.
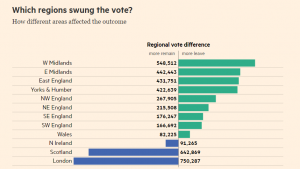
Furthermore, the Financial Times published a map of the United Kingdom to accompany the results, in which the regional differences are easy-to-note.
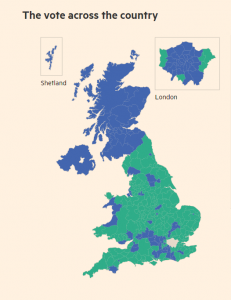
London, Scotland, and Ireland were predicted to vote against leaving the EU — this prediction was correct.
Tags: demographic analysis EU referendum EU referenum results demographics the United Kingdom


 Demographics of Texting